| Maths, Stats and Functional Progamming | ||
| Blogs by Idontgetoutmuch | ||
| Latest | Previous | About |
Data Science in Haskell: An example using temperature data from Thailand and Myanmar
I have just returned from a cycling trip from Bangkok to Yangon. It was pretty hot. My bike computer (Garmin Edge 1000) read 44.7C (112.5F) at one point. I was able to download the data it had collected. As I was not the only person on the trip who wanted to analyse the data, I thought I’d just process the .gpx file and produce a .csv file for general consumption. But given I always have to look up how to do various data manipulations, I thought I would write up what I have done so that I can reference it in the future.
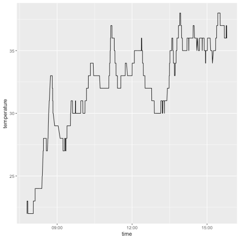
Here’s a chart showing the temparuture for one day cycling in Thailand.
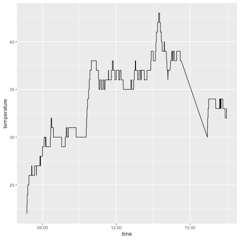
And here’s another showing the temperature for one day cycling in Myanmar.
> {-# OPTIONS_GHC -Wall #-}
> {-# OPTIONS_GHC -fno-warn-unused-do-bind  #-}
> {-# OPTIONS_GHC -fno-warn-orphans         #-}
> {-# OPTIONS_GHC -fno-warn-name-shadowing  #-}
> {-# LANGUAGE OverloadedStrings #-}
> {-# LANGUAGE TemplateHaskell #-}
> {-# LANGUAGE DataKinds #-}
> {-# LANGUAGE FlexibleContexts #-}
> {-# LANGUAGE QuasiQuotes #-}
> module Main (main) where
First a lot of imports. One day we will have a single import for all the libraries needed to do R-like data analysis.
> import Control.Lens (to, only,(^?),ix, toListOf, (^.))
> import Control.Arrow ((&&&), (***))
> import Data.ByteString.Lazy (ByteString)
> import qualified Data.ByteString.Lazy as BS
> import Data.Text (Text)
> import qualified Data.Text as T
> import Data.Text.Encoding.Error (lenientDecode)
> import Data.Text.Lazy.Encoding (decodeUtf8With)
> import Text.Taggy (Node)
> import Text.Taggy.Lens (html, elements, children, contents,
>                         allNamed, attrs)
> import Data.HashMap.Lazy (HashMap)
> import qualified Data.HashMap.Lazy as H
> import Data.Maybe (catMaybes)
> import Frames
> import Frames.CSV
> import Frames.ShowCSV
> import Data.Vinyl (Rec(..))
> import Data.Time.Clock(UTCTime(..))
> import Data.Time.Format
> import Data.Time.LocalTime hiding (TimeOfDay)
> import qualified Language.R as R
> import Language.R.QQ
We want to create records of the position, time of day and temperature that can be written using the Frames package.
> declareColumn "latitude" ''Double
> declareColumn "longitude" ''Double
> declareColumn "timeOfDay" ''UTCTime
> declareColumn "temperature" ''Double
The elevation, time and temperature are children of the “trkpt” node.
> data TimeTemp =
>   TimeTemp { ele  :: Text
>            , time :: Text
>            , temp :: Text
>            }
>   deriving (Show)
The position on the other hand is an attribute of the “trkpt” node.
> data Pos =
>   Pos { lat :: Text
>       , lon :: Text
>       }
>   deriving (Show)
> trkpt :: [Node] -> Maybe TimeTemp
> trkpt row = do
>   ele    <- row ^? ix 0 . contents
>   time   <- row ^? ix 1 . contents
>   temp   <- row ^? ix 2 . elements . elements . contents
>   return $ TimeTemp ele time temp
> temperatures :: ByteString -> [Maybe TimeTemp]
> temperatures = toListOf
>                $ to (decodeUtf8With lenientDecode)
>                . html . allNamed (only "trkpt") . children . to trkpt
> positions :: ByteString -> [HashMap Text Text]
> positions = toListOf
>                $ to (decodeUtf8With lenientDecode)
>                . html . allNamed (only "trkpt") . attrs
The date and time seem to use this format.
> tFormat :: String
> tFormat = "%Y-%m-%dT%H:%M:%S%QZ"
We’ll save it and also provide it to R for plotting using another format (why not?).
> tFormatR :: String
> tFormatR = "%Y-%m-%d %H:%M:%S"
> pTime :: Monad m => String -> m UTCTime
> pTime = parseTimeM True defaultTimeLocale tFormat
> instance ShowCSV UTCTime where
>   showCSV = T.pack . formatTime defaultTimeLocale tFormat
Attributes are returned as a HashMap.
> f :: HashMap Text Text -> Maybe Pos
> f m = do
>   lat <- H.lookup "lat" m
>   lon <- H.lookup "lon" m
>   return $ Pos lat lon
> g :: (Maybe Pos, Maybe TimeTemp) -> Maybe (Pos, TimeTemp)
> g (posM, uM) = do
>   pos <- posM
>   u   <- uM
>   return (pos, u)
Create a record using and for use in the Frames package.
> h :: (Pos, TimeTemp) -> Record '[Latitude, Longitude, TimeOfDay, Temperature]
> h (p, tt) = case pTime (T.unpack (time tt)) of
>               Nothing -> error "Failed to parse time"
>               Just u  -> (read (T.unpack (lat p))) &:
>                          (read (T.unpack (lon p))) &:
>                          u &: (read (T.unpack (temp tt))) &: RNil
Finally we can take the input and parse it into a list of records.
> preCSVs :: ByteString -> [Record '[Latitude, Longitude, TimeOfDay, Temperature]]
> preCSVs = map h . catMaybes . map g .
>           map (f *** id) . uncurry zip . (positions &&& temperatures)
And with this we can now do some analysis.
> analyseGpx :: String -> String -> String -> IO ()
> analyseGpx fName dName cName = do
>   ts <- BS.readFile fName
>   let csvs = preCSVs ts
>   writeCSV cName csvs
>   let temps :: [Double]
>       temps = fmap (^. temperature) csvs
>       tods :: [String]
>       tods  = fmap (formatTime defaultTimeLocale tFormatR) $
>               fmap (utcToZonedTime (minutesToTimeZone (6 * 60 + 30))) $
>               fmap (^. timeOfDay) csvs
>   R.runRegion $ do
>     [r| library(ggplot2) |]
>     fig0 <- [r| ggplot() |]
>     df <- [r| x = as.POSIXct(tods_hs, format = tFormatR_hs)
>               data.frame(time = x, temperature = temps_hs) |]
>     [r| print(head(df_hs)) |]
>     fig <- [r| fig0_hs + geom_path(data = df_hs, aes(x = time, y = temperature)) |]
>     [r| png(filename=dName_hs) |]
>     [r| print(fig_hs) |]
>     [r| dev.off() |]
>     return ()
> main :: IO ()
> main = do
>   analyseGpx "data/activity_3457805023.gpx" "diagrams/temperature.png" "Burma.csv"
>   analyseGpx "data/activity_3439353899.gpx" "diagrams/temperature1.png" "Burma1.csv"